


Our Mission
Simplicity, Transparency
Kryll³ simplifies Web3 and opens up the complex world of cryptocurrencies to everyone. Our advanced AI tools give you clear, actionable advice on Web3 investments.
Our intelligent tools equip you with the knowledge to easily and confidently handle crypto. With Kryll³, you get a clear guide to making the most of digital assets.
Take Control Today


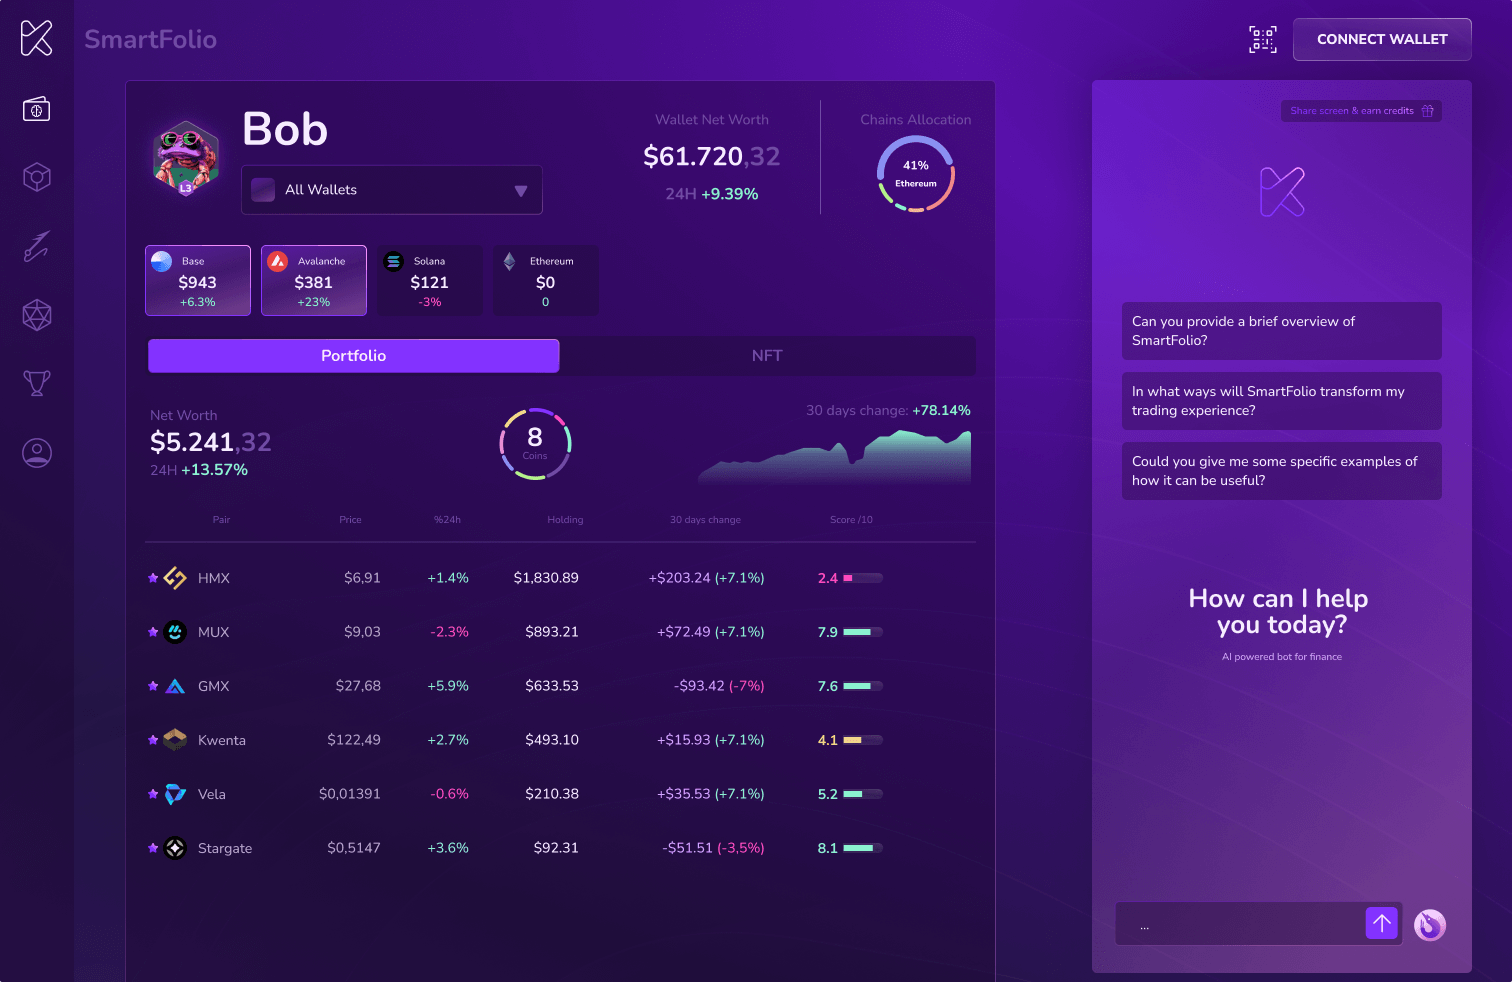
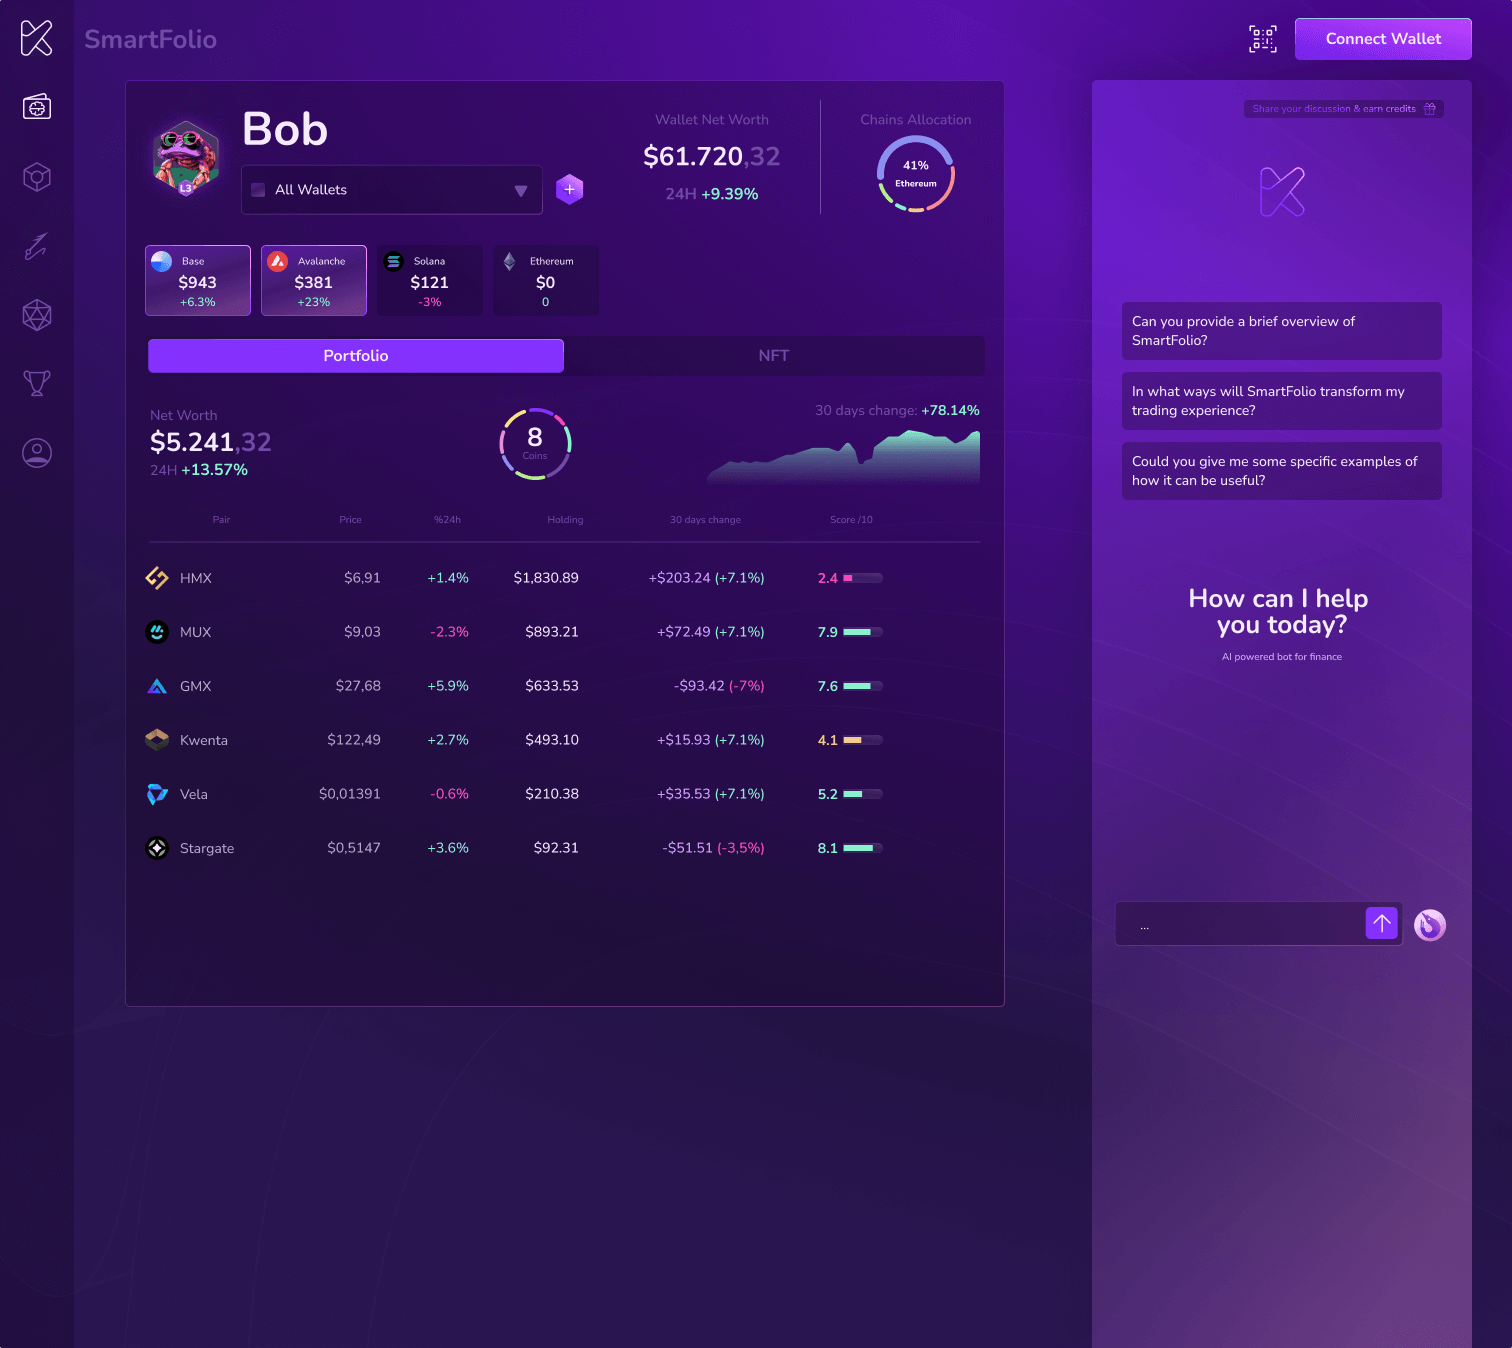
SmartFolio
Track and optimize your entire Web3 portfolio across Ethereum, Solana, and EVM-compatible Layer 2 solutions with SmartFolio, powered by advanced AI for real-time insights and personalized financial guidance.
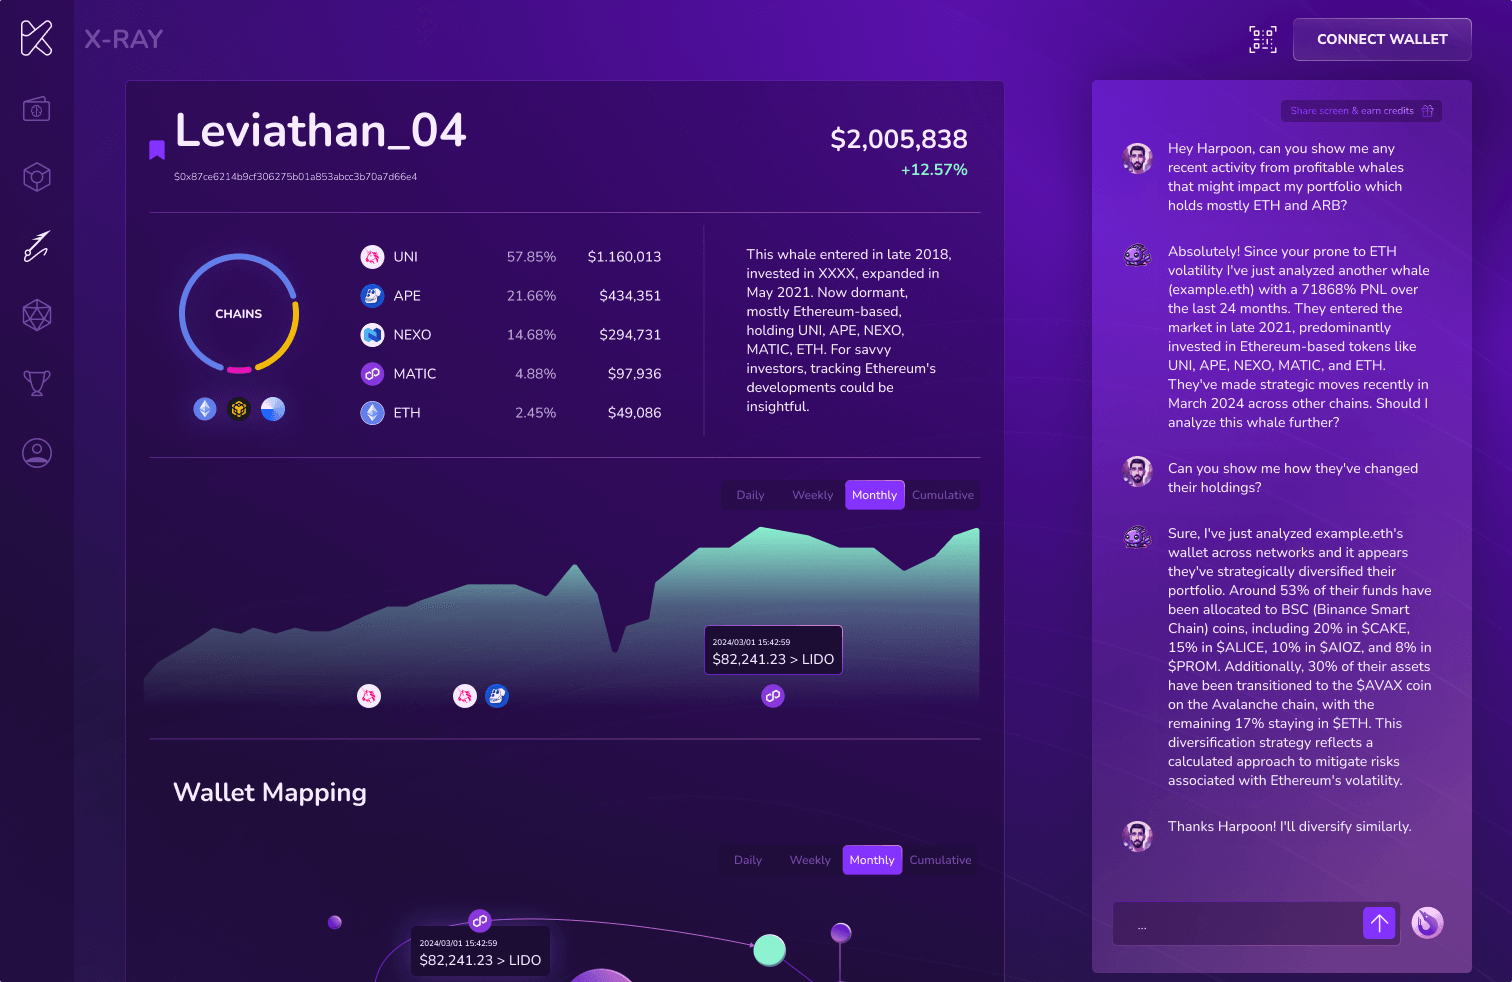
X-Ray
Explore On-Chain metrics, social media trends, fundamental news, chart formations & Technical Indicators, Team wallet activities and the overall industry potential with clarity and simplicity.
Gem Detector
Dive into tomorrow's crypto gems with targeted analysis. Uncover emerging tokens through on-chain data, social buzz, and deep learning insights, guiding you to informed decisions with precision and ease.
Harpoon
Track the smart money's moves in real-time. Gain exclusive insights into top traders' strategies, major transactions, and market trends, empowering your investments with data-driven confidence.
We’re Redefining the Future

Google AI

Anthropic

Google Cloud
Backed by industry giants, we’re not just innovating – we’re leading a revolution in AI and Web3. With partners like Google investing in our vision, we’re breaking barriers to democratize AI-driven solutions, empowering everyone to thrive in the decentralized era.
SmartFolio
Master Your Crypto Portfolio
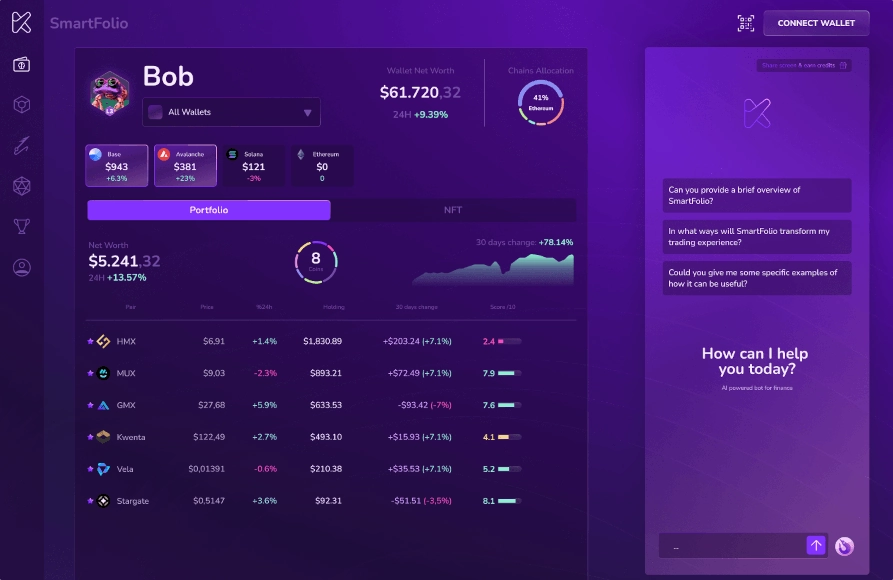
SmartFolio helps you manage your crypto portfolio smarter. It tracks and analyzes your crypto holdings across multiple blockchains, including Ethereum, Solana and Layer 2 EVMs, using AI. This tool combines all your tokens, DeFi protocols, and NFTs into one easy-to-use interface. It also gives you real-time updates and personalized tips.
SmartFolio is more than just tracking; it actively improves your investments with advice from a smart AI agent. Whether you're managing current assets or finding new opportunities, SmartFolio makes navigating the crypto world simple and secure.
X-Ray
Clarity in Crypto
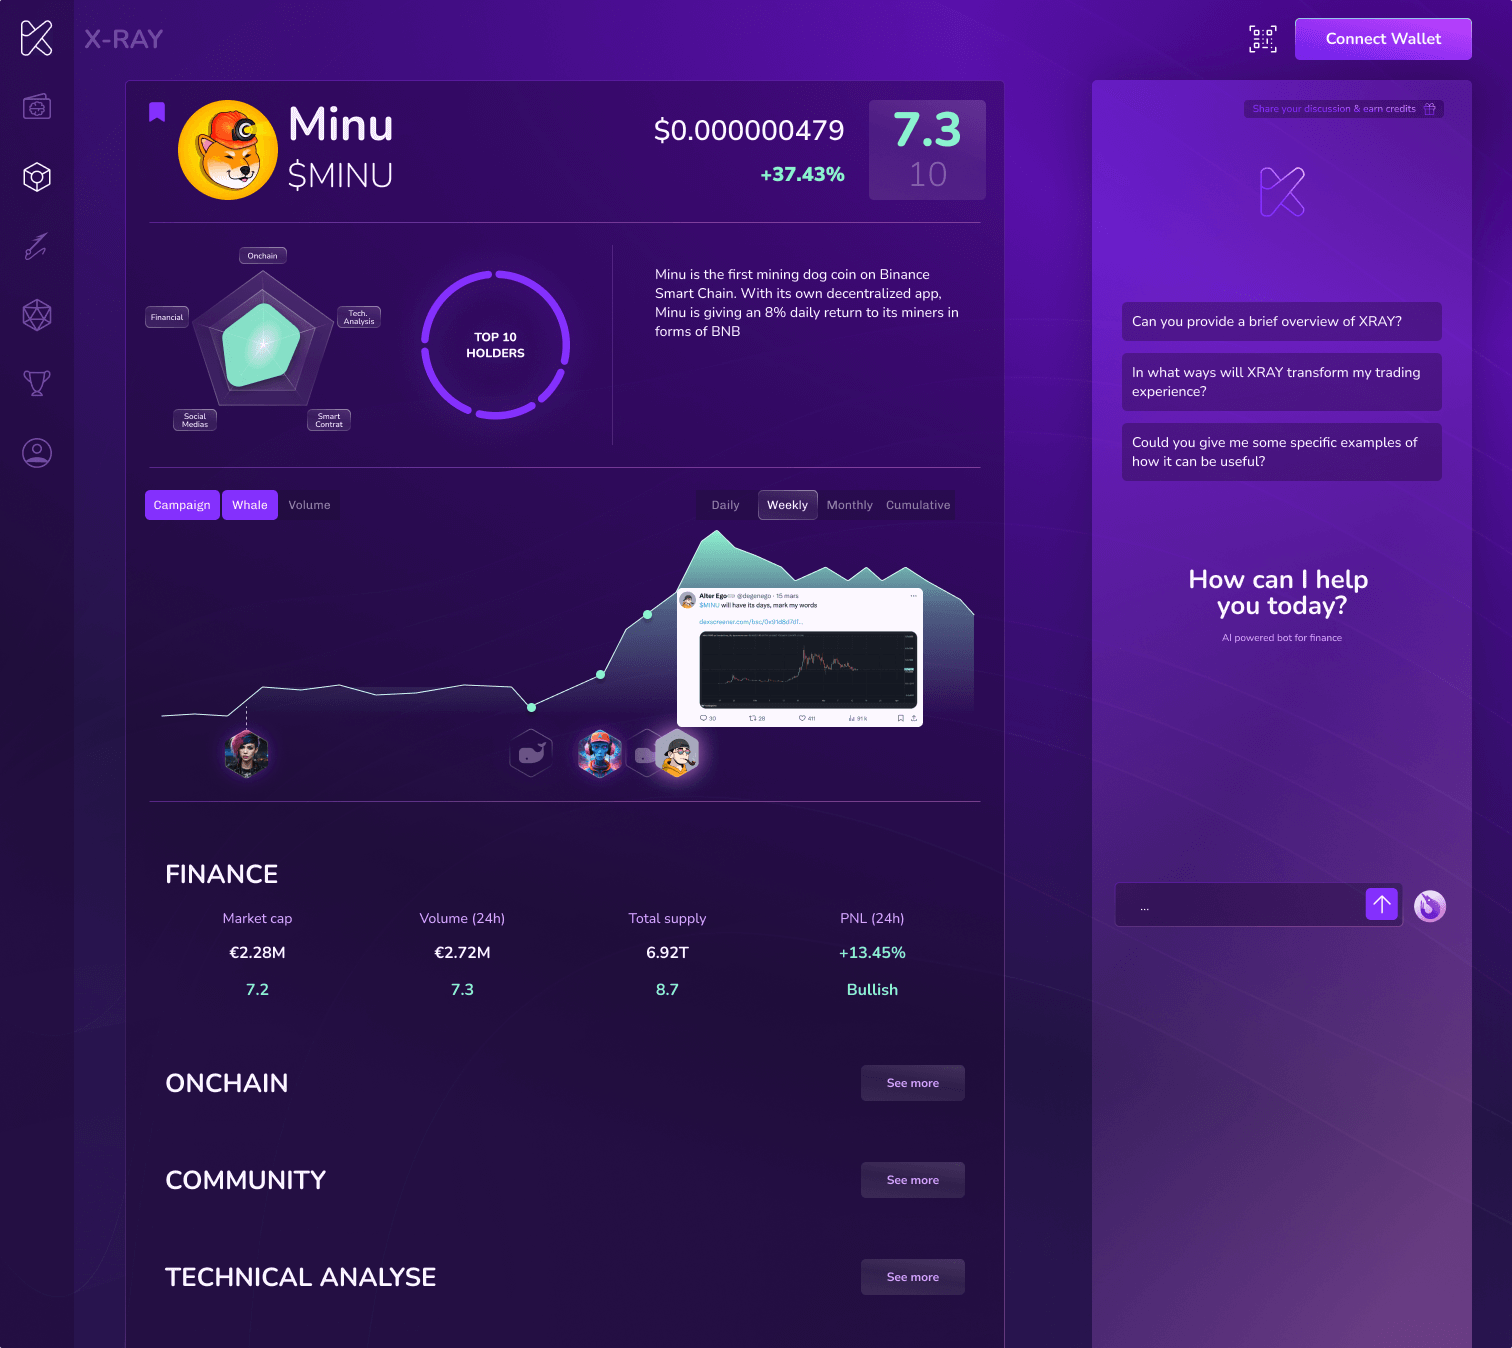
X-Ray is your smart Web3 assistant that simplifies cryptocurrency investing. It uses deep learning and predictive algorithms to evaluate tokens by analyzing smart contracts, on-chain data, social activity, and financial indicators.
With clear visuals and educational tips, X-Ray makes investing in Web3 tokens easy for both beginners and experts. Whether you're learning about a specific token, seeking investment alerts, or expanding your Web3 knowledge, X-Ray is your essential tool. Make informed decisions quickly and master digital assets effectively.
Gem Detector
Catch Today Tomorrow's Success
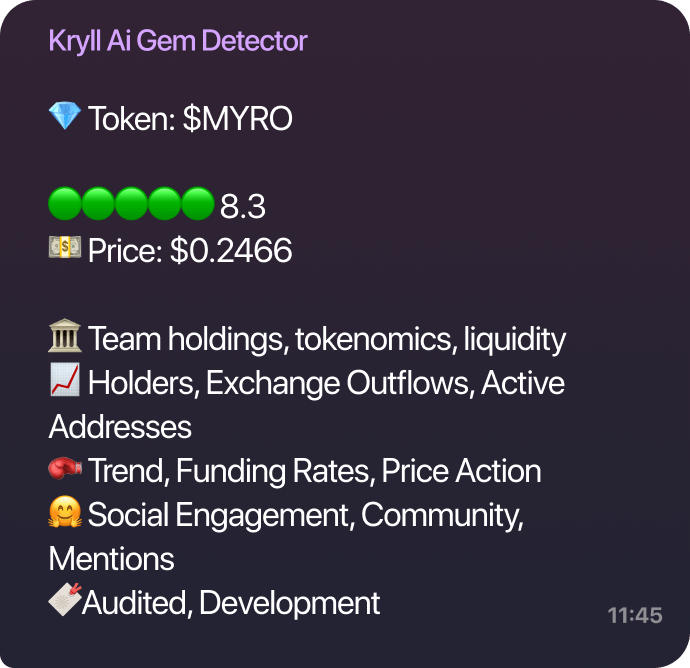
Gem Detector is your tool for finding emerging tokens before they go mainstream. This multi-chain monitoring tool automatically evaluates new tokens with advanced algorithms and deep-learning models, assessing their risks and potential in real-time.
By analyzing on-chain data, social media buzz, and chart patterns, Gem Detector identifies tokens with high growth potential. Whether you're an experienced investor aiming to expand your portfolio or a newcomer eager to start, Gem Detector gives you the insights needed for success in the fast-moving crypto world.
Harpoon
Follow the Smart Money
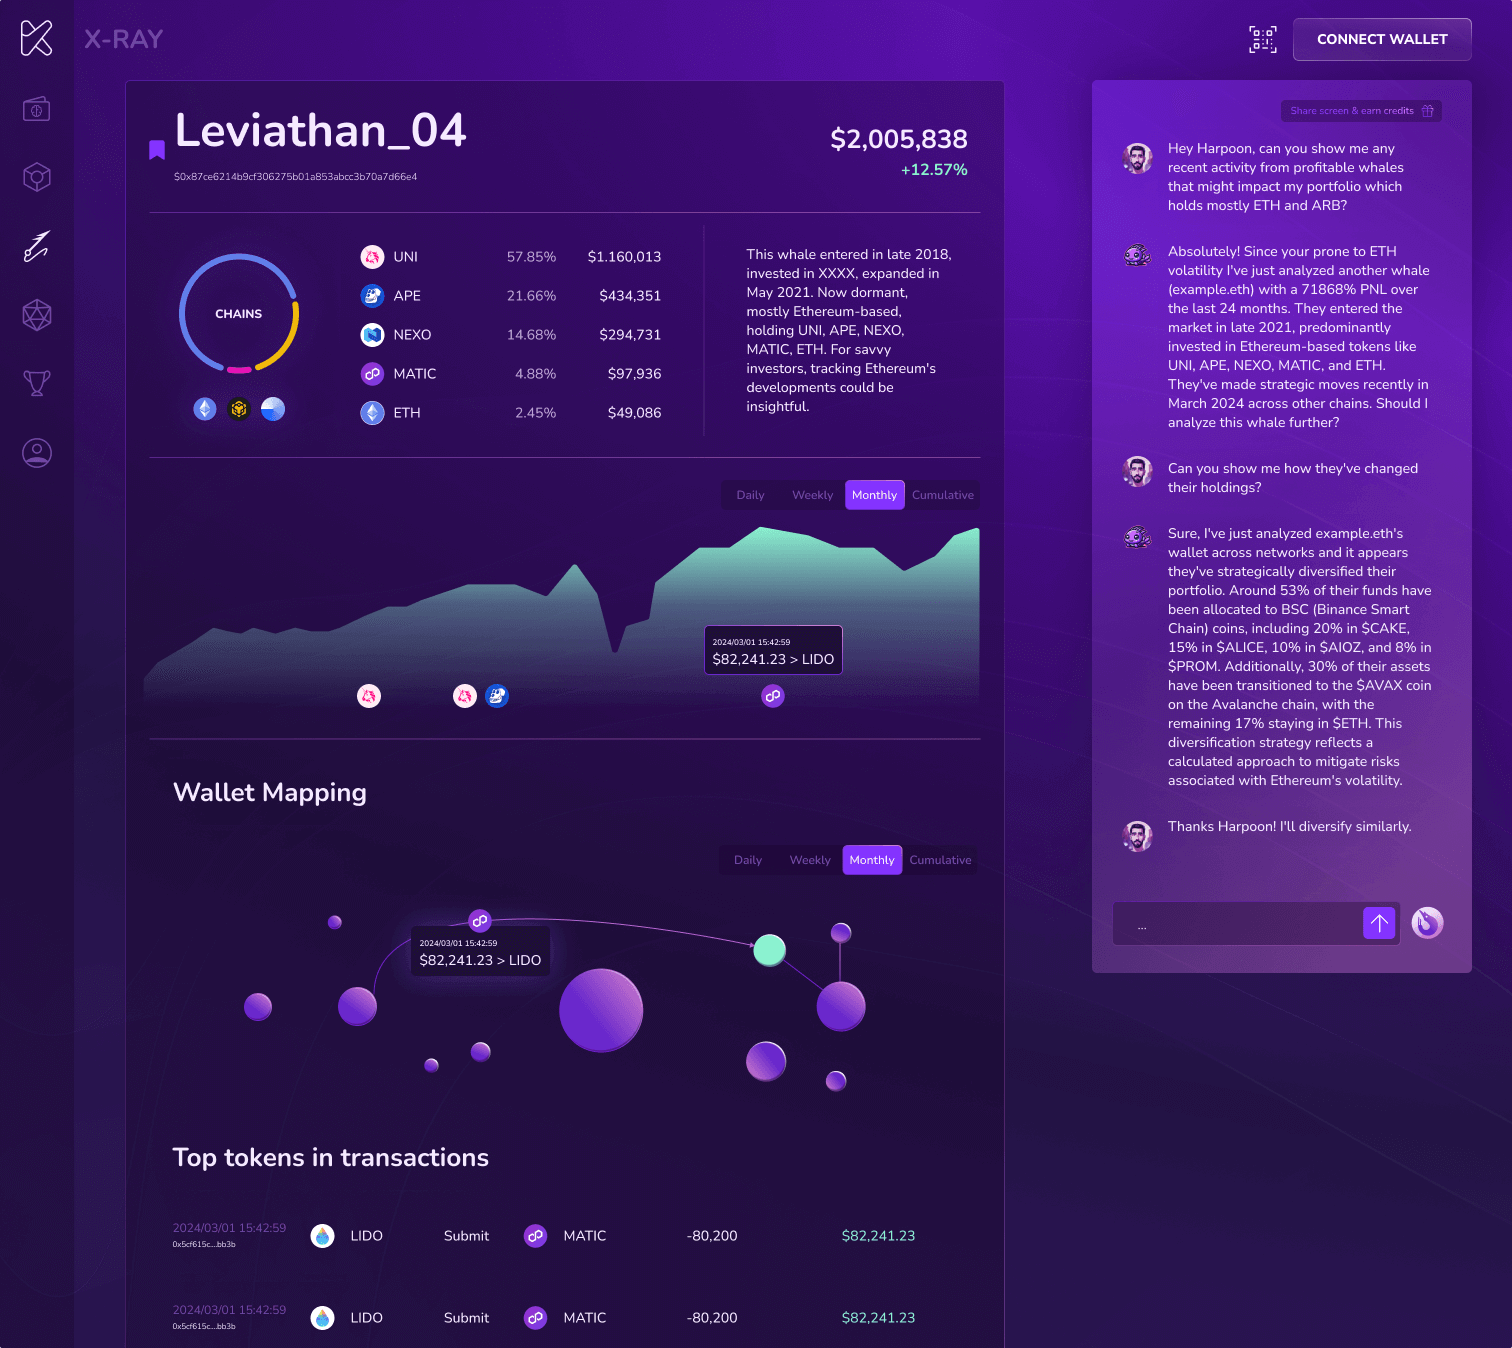
Harpoon is an AI-enhanced wallet mapper that tracks 'smart money' movements in the crypto world. It monitors top traders’ strategies and transactions, providing deep market insights.
This tool combines advanced on-chain analytics and deep-learning wallet labeling with a real-time alert system. Harpoon simplifies tracking high-stakes financial moves, making it accessible for investors at all levels and offering precise strategic guidance.